
Datasets
Central to Sparque Desk are knowledge graphs. They allow data from different sources and types to be linked together into one rich model of a domain. We call the process of creating a knowledge graph from separate data sources "data virtualization". It consists of a number of steps that you can perform in the Datasets section of Sparque Desk.
Adding Data Sources
The first step in data virtualization is defining where your source data is located and how it can be read. You do this by creating a dataset and filling it with one or more data sources. Data sources can be XLSX, JSON, XML, CSV or RDF files, as well as connections to SQL databases or remote APIs, and many others.
The following settings are available for each data type:
- Upload:
Upload a static file to Sparque Desk. Please note that static files cannot be pushed to our production environment. Use static files for debugging purposes only. If you are pushing something to production with a static file, you must specify a location in your request. - Fetch the File:
Files can be fetched from an online location, which is often used with locations such as Azure File Storage or Blob Storage. This location does not need to be specified when pushing to production. - Display Name:
Add a display name so it is easy to find the pipeline in the dataset overview.
Data sources are automatically configured. If the default settings do not apply to your data source, you can adjust them manually. For individual settings for each data type, see Data Type-Specific Settings.
Sparque Desk converts all data sources into virtual XML fragments. For example, given a CSV file actors.csv:
actorID,actorName
1,John Travolta
2,Uma Thurman
Sparque Desk produces the following two XML fragments:
<row>
  <field column="0" name="actorID">1</field>
  <field column="1" name="actorName">John Travolta</field>
</row>

<row>
  <field column="0" name="actorID">2</field>
  <field column="1" name="actorName">Uma Thurman</field>
</row>
The virtual XML unifies the syntax for the next step in the data virtualization process, mapping the data to a knowledge graph. The virtual XML can be more verbose than the source data. This does not really matter as the fragment only exists virtually. It will never be written to disk during the indexing process.
File Size
You can upload multiple files to a single pipeline. The maximum file size for uploads is 8 GB per individual file. However, this limit applies to the uncompressed size. For example, a compressed file smaller than 8 GB might exceed the limit when uncompressed, potentially causing system issues.
Connected Pipeline Compression
To improve the speed of uploading your data into pipelines and reloading graphs, we recommend that you upload compressed data, also known as connected pipelines. Connected pipeline compression is supported for XML, JSON, and CSV pipelines. Decompression is supported for the following formats: GZip, Z-Standard, BZip2, and Z. This section explains how the system determines which decompression method to use.
Decompression Based on URL Extension
The system first attempts to determine the decompression method based on the file extension in the URL. Here are some examples:
http://example.org/contents.gzwill be decompressed using GZip.http://example.org/contents.zstdwill be decompressed using Z-Standard.
Decompression Based on Query String
If the URL does not have an obvious file extension, the system checks the query string for a format parameter, which should contain the MIME type of the compression format. Here are some examples:
http://example.org/contents?format=application/gzipwill be decompressed using GZip.http://example.org/contents?format=application/x-bzip2will be decompressed using BZip2.
Unsupported Formats
If the format parameter value is not recognized or supported, no decompression will be applied. Note that .zip and .7z formats are not supported, as they can contain multiple files.
Note:
.zip and .7z formats are not supported, as they can contain multiple files.
Defining Data Mappings
The second step in data virtualization is the mapping of the virtual XML fragments to the knowledge graph. This is visualised in the image below:
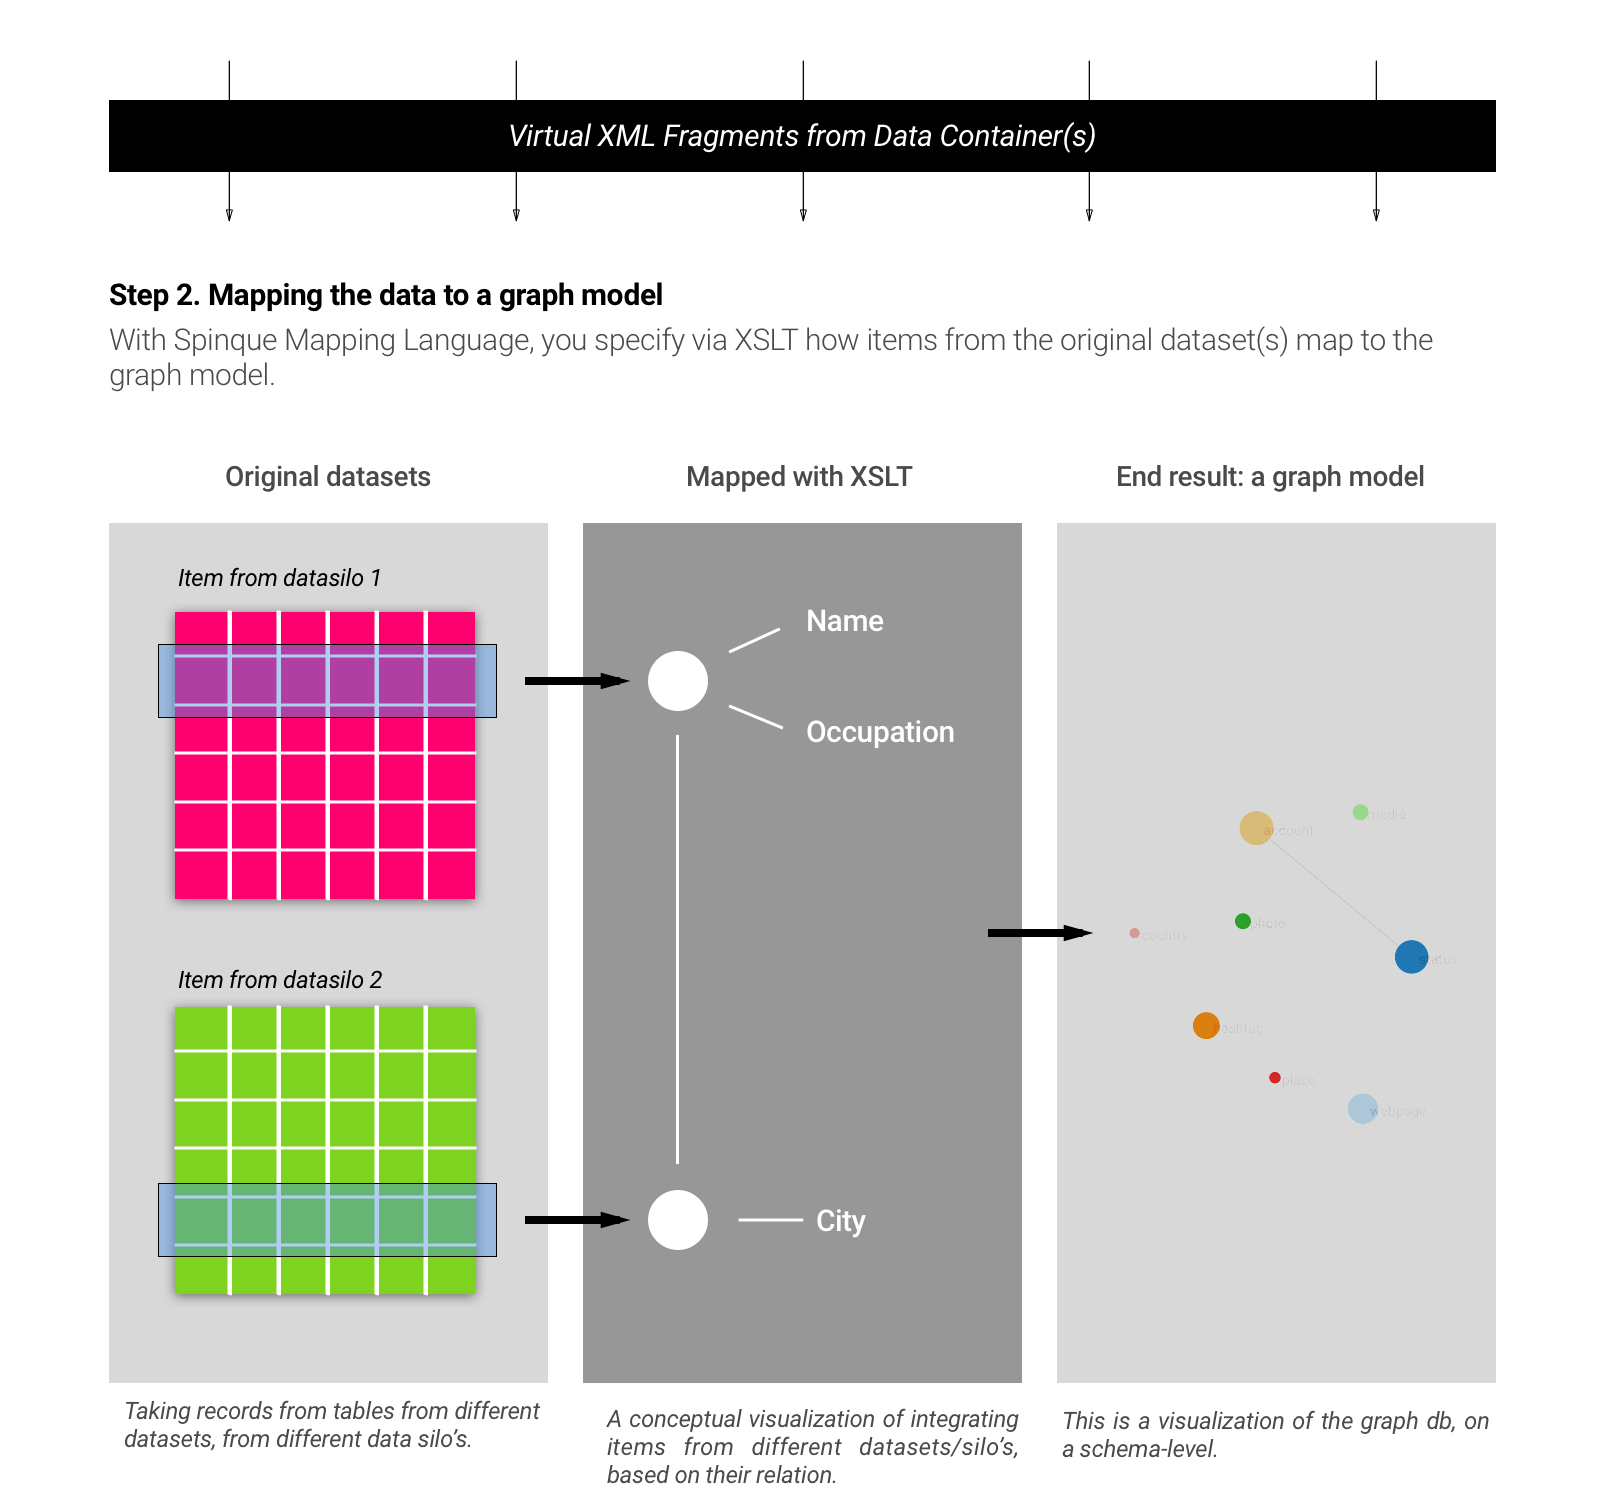
Data Mapping
For each data source, we define a mapping in the Sparque Mapping Language. The mapping language is an extension of XSLT, a transformation language for XML. As in any XSLT, you define templates that match with elements in your XML data. In this case, the virtual XML that comes out of a data source. The key differences between a normal XSLT file and a Sparque data mapping is that we do not write the normal textual output of the XSLT, but instead generate triples.
We assume that you have basic knowledge of writing XSLT. You do not need to know how to execute XSLT. Sparque takes care of the whole pipeline for you. The documentation of the mapping language explains in detail how to create a mapping:
By including the su (Sparque Utilities) namespace in your data mapping, you get access to some additional utility functions. Examples are methods to transform strings, such as changing the case, splitting, and normalizing. There are also methods for processing numbers, dates and person names:
You have to decide yourself which attributes, relations and types (classes) you want to model and how you want to name them. This does not mean that you have to invent all of them yourself. There are many vocabularies available. The Open Knowledge Foundation provides an extensive overview of vocabularies.
We advise to reuse existing vocabularies whenever available. When your domain requires a more specific vocabulary, you can extend existing vocabularies. But in some cases, it also makes sense to invent your own vocabulary.
Loading Your Graph
The third and final step in data virtualization is storing the triples that are generated by your data mapping(s) in Sparque's graph database. In this step, the data mappings that you wrote are applied to all the data in your data sources. We often refer to this step as indexing or loading.
With the completion of this step, the data virtualization process is finished. You'll now be able to inspect the result; to take a look at the objects, attributes and relations that make up your knowledge graph.
In addition, you can share it with specific workspaces or with all of them, and finally, you can use it in search strategies.